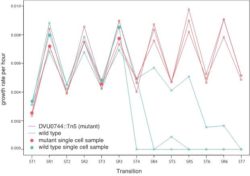
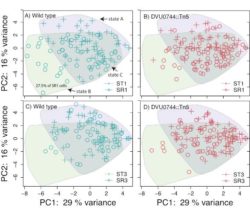
Wild type replicates begin to collapse after 3 transitions while the regulatory mutant grows across all transitions. Each line represents one of three replicate cultures. Filled circle symbols indicate the time-points and replicates that were sampled from WT and mutant for single-cell gene expression analysis.Three cell states were defined among single cells from each condition, including state A (expression pattern present only during ST1 growth in wild type), state B (expression pattern present only during SR1 growth in wild type), and state C (expression pattern present during both SR1 and ST1 growth in wild type).
This website places cookies on your device to give you the best user experience. By using our website, you agree to the placement of these cookies. To learn more, read our Privacy Policy.